COMPONENT PLACEMENT REPORT
Introduction
The component placement report lists the grid square on the schematic sheet (e.g. A1, C3) where a component can be found. It is typically used in review sessions with schematic printouts.
Creating a component placement report requires two steps, namely:
- Placement of grid markers on the master sheet border.
- Generation of the report in Project Notes.
Grid Markers
The good news is that if you are using any of the supplied design templates, all of which come with a border grid, then this step is done and there is no action required. If on the other hand you are using your own template you have a little setup work to do. Bear in mind that you only have to do this once because you can in turn save your border as a Template of your own so it's available to you in future designs.
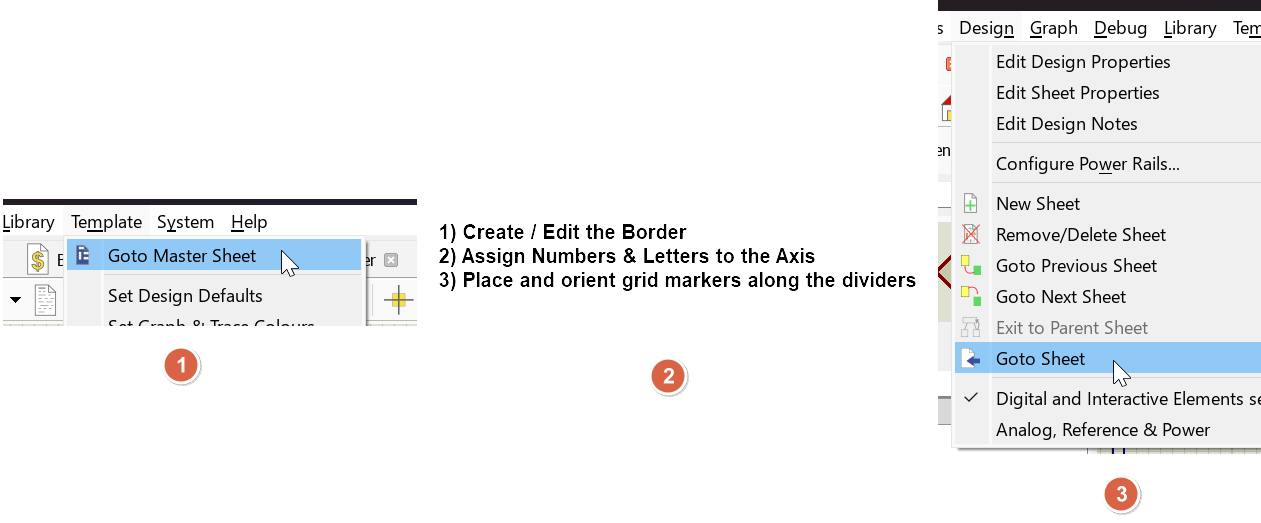
Basic procedure for creating a smart grid with a sheet border
Start by creating a border with numbers on one axis and letters on the other on the Master Sheet. You can get there with the Goto Master Sheet command on the Template menu.
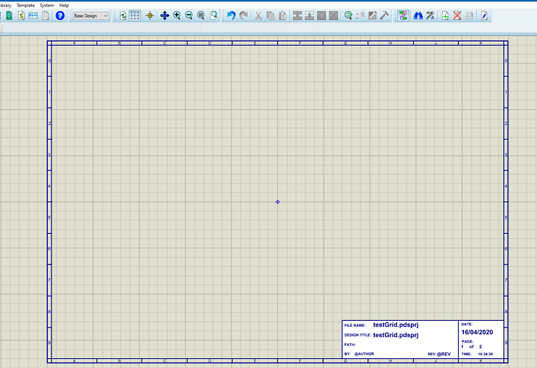
Sheet border with numbers on the Y axis and letters on the X axis, with separators between the cells
Alternatively, just start a design based on one of our templates of the right size and then modify as normal.
Remember that the border should be created on the Master Sheet so that it is visible on all sheets.
Once the border is in place you need to place and orient grid markers along the separators.
To place a grid marker:
- Select 2D Graphics Markers Mode, which appears as Marker on the context menu, and then the GRID marker from the parts bin.
- Left click on the editing window to start placement.
- Use the + and - keys on the numeric keypad to orient the marker such that it aligns with the separator. These are the Rotate Anti-Clockwise and Rotate Clockwise commands.
- Move the marker over the separator and left click again to place.
- Repeat for the other separators.
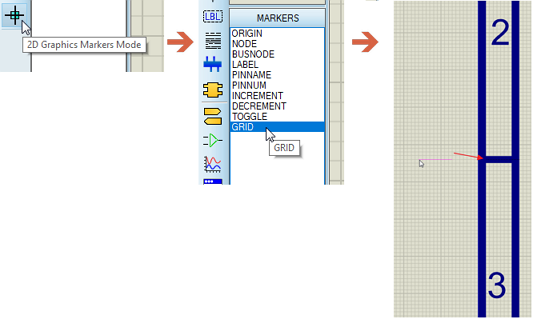
Placing a grid marker over the separator between two named cells
If you can't rotate live just place the marker beside where you want it to go then right click on it and select Rotate Clockwise or Rotate Anti-Clockwise to align it. Finally, right click again and select drag to pick it back up again and move it over the separator.
Orientation matters more than position, because it is the orientation of a marker that decides which axis it belongs to. A vertically oriented marker contributes a column boundary and a horizontally oriented one contributes a row boundary, so a marker left at some other angle contributes to neither axis and is ignored without any message being given.
You are aiming to place a grid marker over each separator on the Y-axis. Then you need to rotate the grid marker so that it aligns with the separators on the x-axis and place a grid marker over each separator. You don't need to place grid markers on all four sides. One horizontal side and one vertical side is enough. Proteus will extend these markers internally across the sheet to slice the sheet into sections and will then identify which components are in each section. This data, along with the section names (A4, C2, etc) is what populates the component placement report.
At least two markers are needed on each axis, since two column boundaries and two row boundaries are the minimum that define a cell. A border with only one marker on either axis produces no report at all, only the message described under Troubleshooting below.
You may want to save this border as a template at this stage so that you can re-use in future designs. You can do so with the Save Design as Template command on the Template menu.
Generating the Report
To generate the report simply open the Project Notes module and select the Component Placement Report from the resulting list of templates.
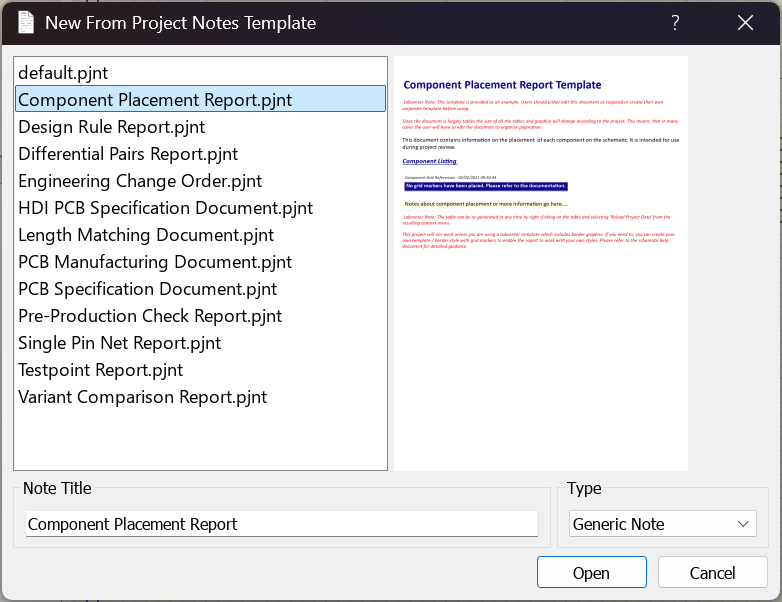
Component Placement Report selected in the New From Project Notes Template dialogue
The report can equally be inserted into a note you already have open, from the Project Data menu, where it is labelled Schematic Grid References rather than Component Placement Report; inserting, reloading and locking report tables are covered in one place in the Project Notes manual.
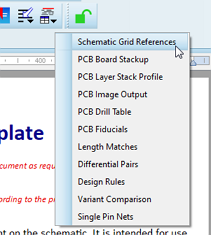
The component placement report, labelled Schematic Grid References on the Project Data menu, chosen for insertion into a custom report
Project Notes : Supplied Reports
The table itself is very simple. It carries three columns, Element, Grid and Sheet Title, and gives one row for each named component and each named physical terminal on the current board, sorted by reference and then by sheet. The grid reference is given as a letter followed by a number, matching the lettering and numbering of your border. This makes for quick lookup when the schematic is printed out onto sheets of paper.
Once inserted the report is static. To bring it up to date after editing the schematic, check that the project note is unlocked and then choose Reload Project Data from the right click context menu on the table.
Configuring the Report
The component placement report is the only one of the supplied Project Notes reports that can be reconfigured after insertion. Right click on the inserted table and choose Modify to open the Configure Report dialogue, which offers two settings.
Report name
The title given to the table. Change it if you want the report to sit under a heading of your own wording.
Elements per row
How many groups of the three columns are repeated across the page, from one to four. The default is two. A long parts list is much easier to read on paper at three or four groups per row, at the cost of a narrower Sheet Title column. Note that the list runs down each group of columns in turn rather than across the page, so the second group continues where the first leaves off.
Troubleshooting
If Proteus cannot find a usable grid it produces a report consisting of the single line "No grid markers have been placed. Please refer to the documentation." There are three common causes:
- There are fewer than two grid markers on one of the two axes.
- One or more markers are at an orientation that belongs to neither axis, so they are being ignored.
- The border and its markers were drawn on an ordinary sheet rather than on the Master Sheet, and the sheet you are reporting on is a different one.
A sheet which carries grid markers of its own uses them in preference to those on the Master Sheet, which is useful when one sheet of a design is a different size from the rest. The other side of that is that a sheet with no grid available to it is skipped silently: as long as one sheet in the design has a grid, a report is produced, and the components on the gridless sheets simply do not appear in it.
Components which sit outside the outermost markers are listed, but they cannot be given a valid grid square and their grid reference is not meaningful. Keep the border grid large enough to enclose the whole of the drawing area you use.
Note of course that inside the Proteus software you can cross probe using the Design Explorer or use Search & Tag to quickly zoom in to a part.
See Also: